Run your OEE with cockpit precision
An OEE figure computed at month end cannot be steered — only observed. Lesly Performance consolidates OEE, OPE and TEEP continuously, prices losses in euros and rebuilds your cycle timeline, with no operator input.
-
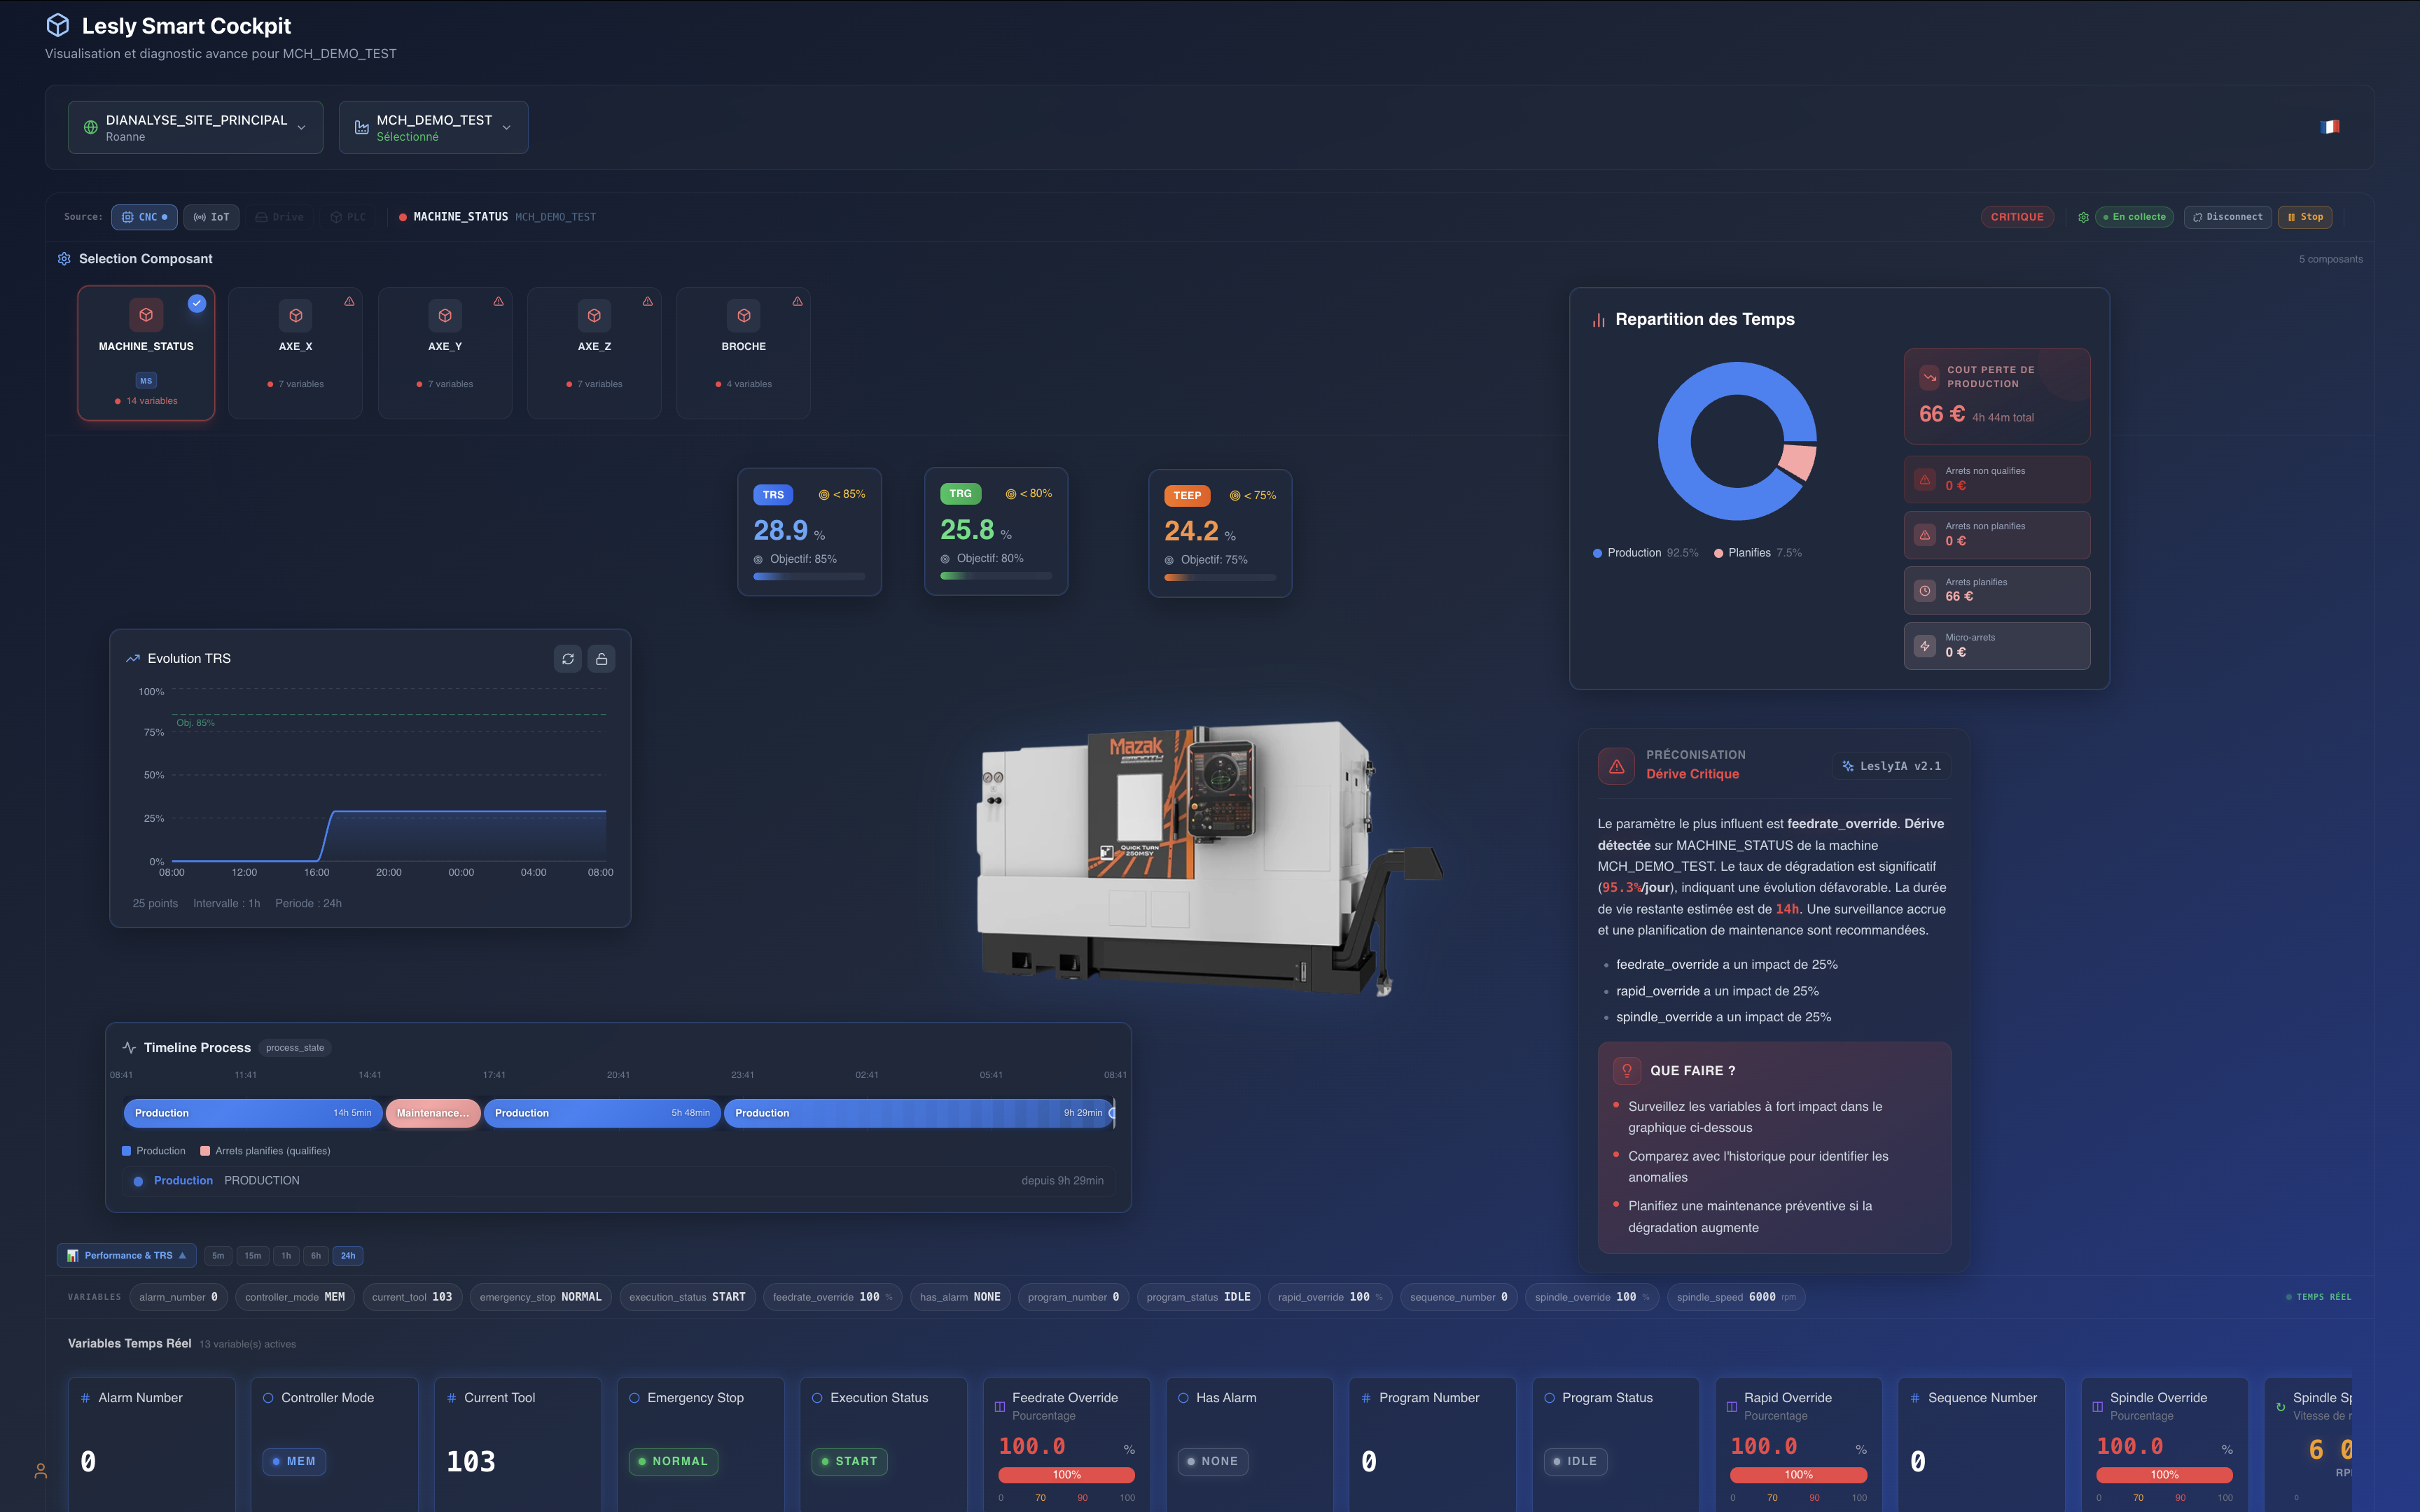
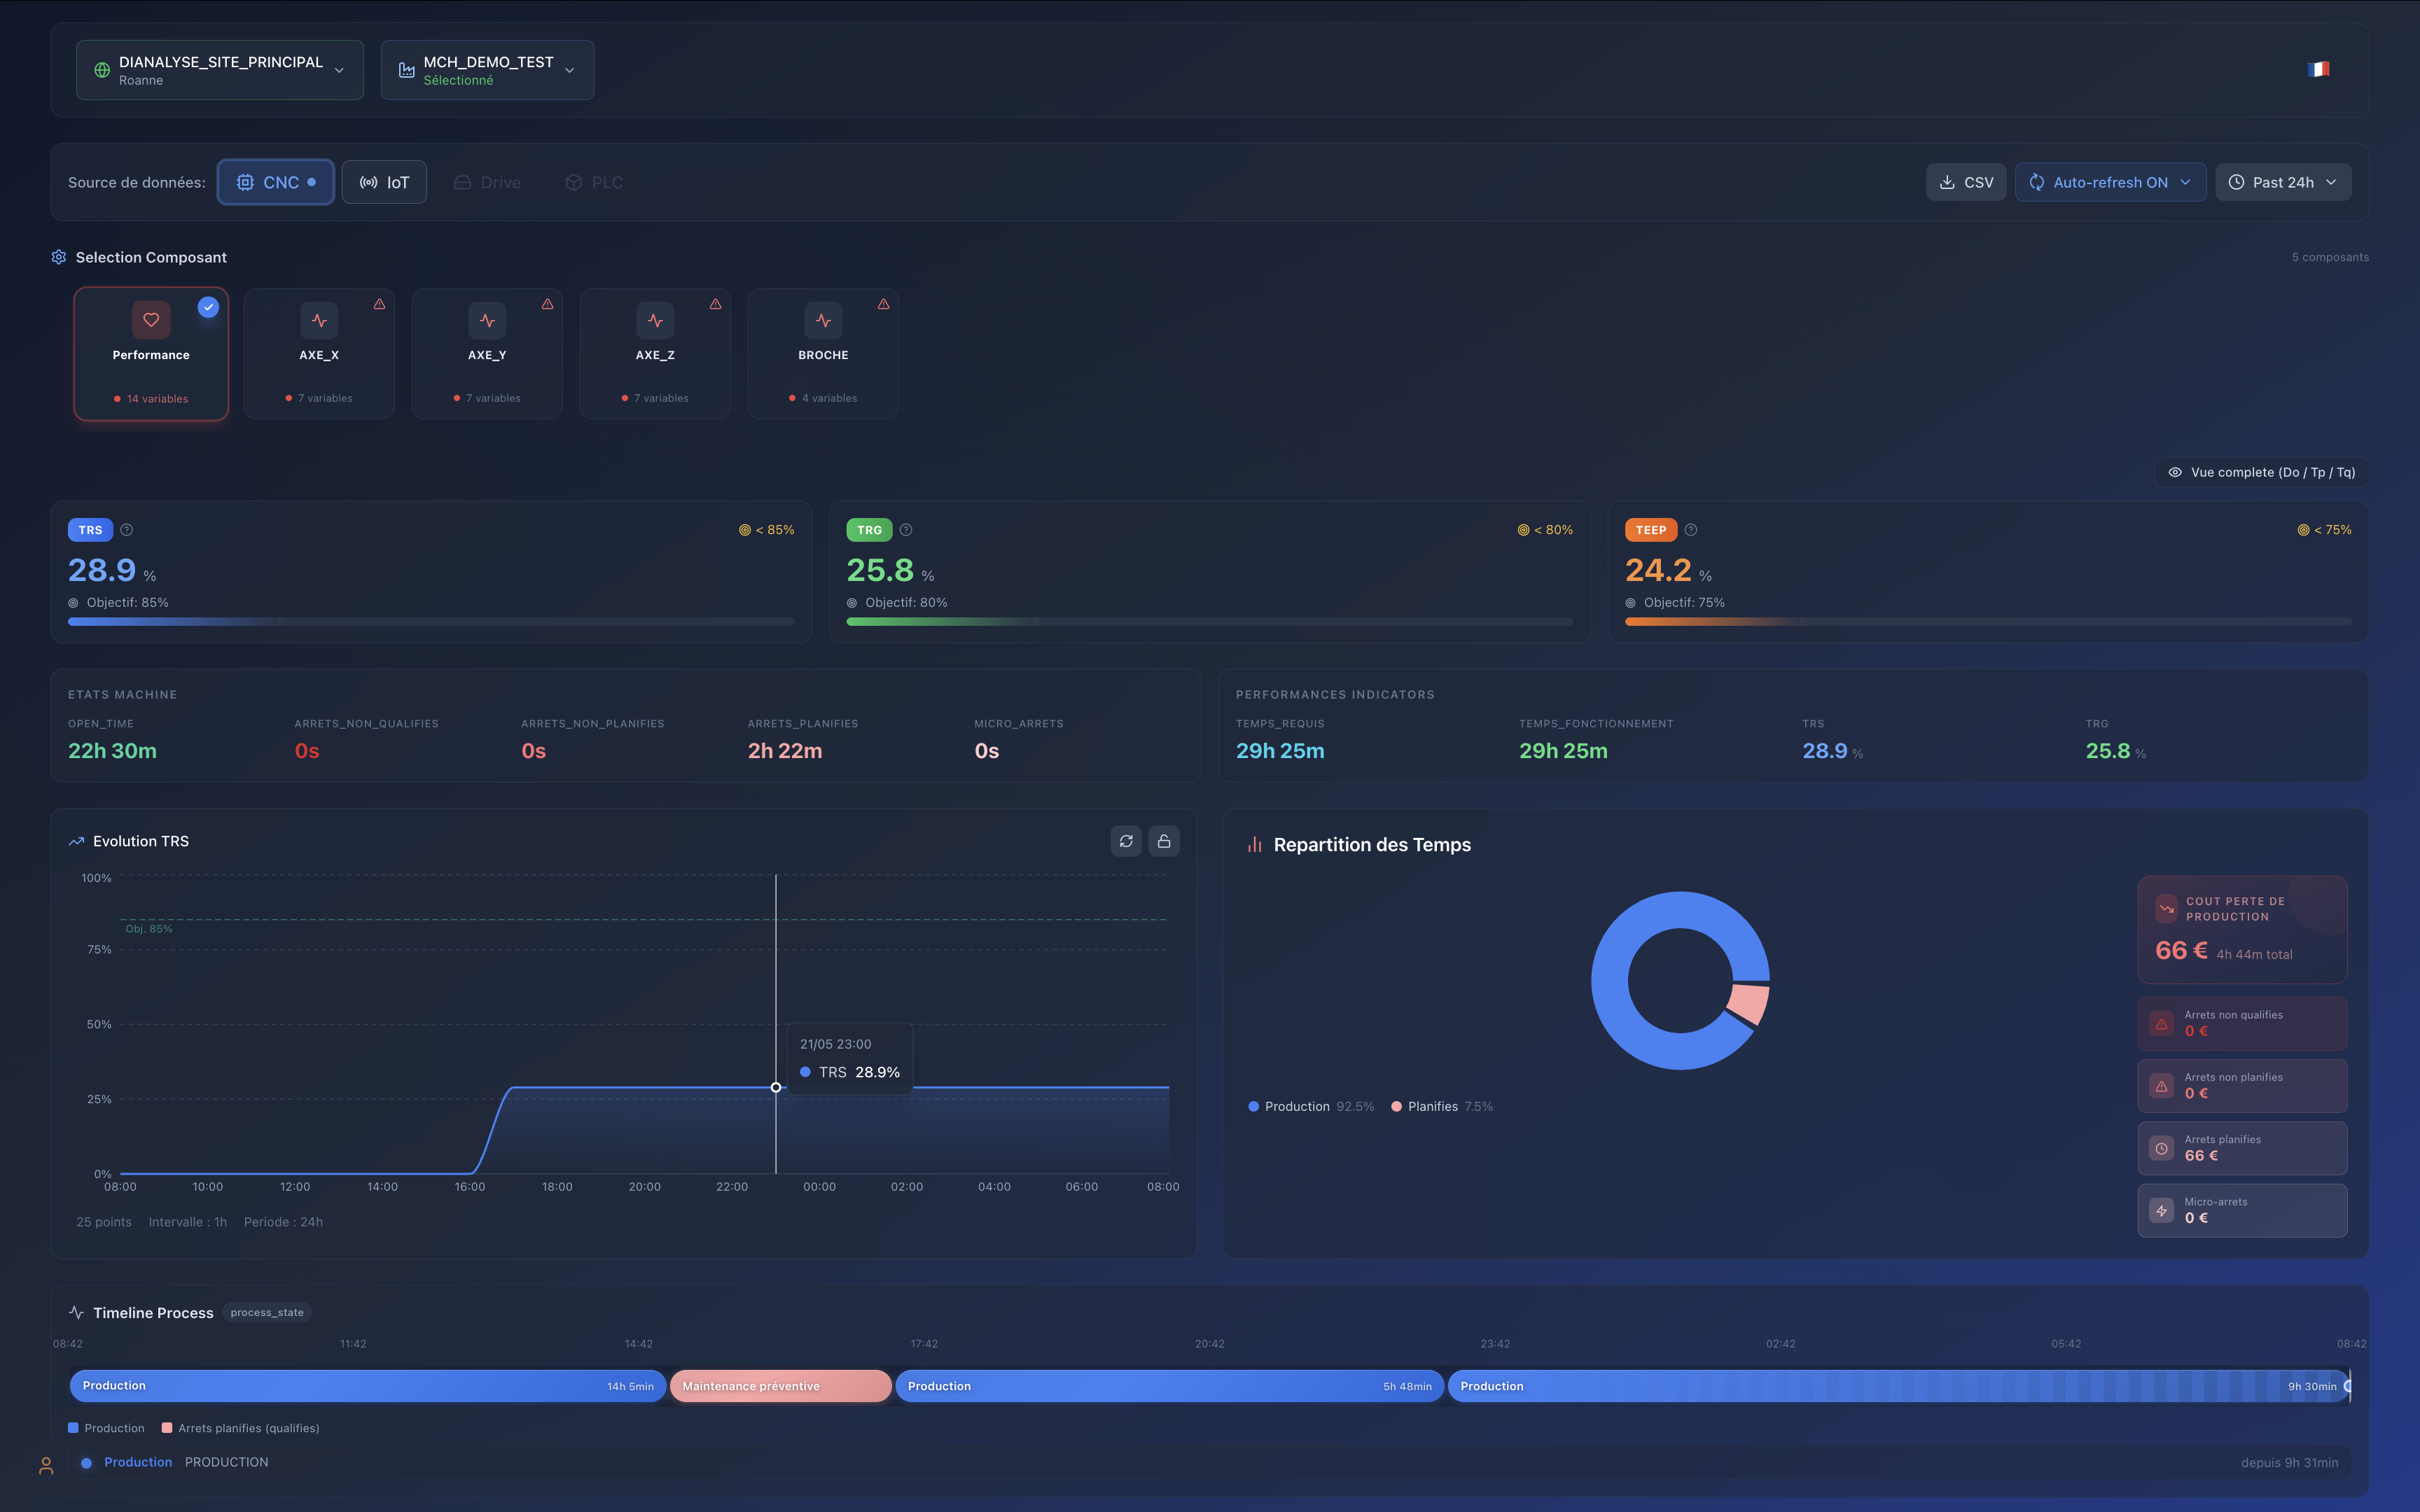
28.9% — Measured OEE · 85% target
-
€66 — Priced loss · 4h44
-
0 — Operator entries
-
seconds — To connect a machine
-
Module : Lesly Performance — productivity
-
What is measured : OEE, OPE, TEEP, priced losses, opening time and micro-stops
-
Who it is for : Production, scheduling, continuous improvement, management
-
Collection : No operator entry, no change to the NC program
-
Licence unit : Annual subscription per machine
-
Connectivity : Four profiles — CNC, PLC, Drive, IoT — one engine
What management understands is not a percentage. It is a euro.
Reporting 28.9% OEE against an 85% target starts a debate. Reporting €66 of lost production over 4h44 of downtime starts a decision. Lesly breaks that cost down by nature — qualified, unqualified, planned stoppages and micro-stops — and finally makes comparable the losses nobody was putting side by side.
Three indicators, not one
OEE alone flatters or accuses depending on how required time is defined. Lesly computes all three levels in parallel, each against its target: OEE (85%) on operating time, OPE (80%) on opening time, TEEP (75%) on the full calendar. The gap between them is itself a diagnosis: it tells you whether you are losing rate, organisation, or unused capacity.
- OEE · OPE · TEEP consolidated continuously, with per-machine and per-line targets
- Production loss in euros, broken down by stoppage type
- Process timeline rebuilt from the machine — production, maintenance, stoppages
- Real-time variables: feedrate, spindle speed, override, alarms, current tool
- Full historisation with CSV and Excel export
- Digitalised stoppages and root-cause analysis
The timeline fills itself in
No operator entry, no change to the NC program. Lesly reads the PLC and the numerical control directly, then rebuilds the cycles: 14h05 of production, one preventive maintenance window, 5h48 of production, 9h29 running. What your teams used to fill in by hand — when they filled it in — becomes continuous, timestamped and undisputed data.
Multi-brand, multi-protocol, no middleware
OPC-UA, FOCAS2, Heidenhain, S7 PUT/GET, Modbus TCP, EtherCAT, MQTT, ibaPDA, MTConnect. Four connectivity profiles — CNC, PLC, Drive, IoT — one engine. Machines from four different makers finally compare in the same dashboard, with no integration layer to fund and no proprietary lock-in.
Loss in euros, not in points
Non-production cost is broken down by stoppage type. It is the figure management arbitrates without translation.
Three indicators, one diagnosis
The gap between OEE, OPE and TEEP tells you whether you lose rate, organisation or unused capacity.
Nothing declared by hand
The timeline is rebuilt from the machine. No more downtime sheets filled from memory at end of shift.
The whole fleet, comparable
Four brands, four protocols, one dashboard. Machine-to-machine comparison finally becomes legitimate.
Root cause on record
Every stoppage is qualified and historised. The top two causes are often enough to reverse the trend.
No integration cost
No middleware, no bespoke development, no proprietary lock-in to pay for.
With Lesly SmartFactory you are not funding software. You are continuously building the digital industrial asset of your machines.
Commercial presentation 2026
The two modules complete each other
Performance tells you what you are losing and where. Machine Health tells you when it will break and why. Together they close the loop: an observed loss becomes an identified cause, then a planned intervention. An annual subscription per machine for productivity, per component for reliability, with upgrades and the cloud account always included.
Deploy Lesly self-service on one machine, measure over 90 days, then decide. No commitment, no risk to your production.