Lesly IA: machine monitoring and predictive maintenance.
Lesly verifies machine conformity. Cycle after cycle.
Improve your productivity and anticipate breakdowns with Lesly SmartFactory. The platform combines real-time production monitoring with machine health monitoring. Its AI learns your KM0 reference, measures deviations and transforms shop floor data into decisions to produce the correct part and replicate it.
Compliance must be monitored; it cannot be assumed. Using DI-ANALYSE SIGNAL’s KM0 approach, Lesly compares the behaviour of your equipment with its reference performance. Its cube embodies this promise: the square represents the compliant part, the rings represent the cycles that reproduce it, and the core connects part, process and machine.
Try Lesly for free. Your account gives you access to downloads, documentation and the machine library.
Unsupervised learningLocal analysis on LeslyBox
Our customers & partners.
LESLY SMARTFACTORY TECHNOLOGY
A new generation of machine monitoring.
Lesly makes the difference. It brings together six technologies to connect and understand your machines, anticipate deviations and guide your decision-making. Discover how this will transform your workshop.
Choose a technology. Discover how it can make a difference for you.
EXPLORE LESLY INTELLIGENCE
Your data comes to life. Your decisions – one step ahead.
Select a face of the cube to discover the technology, its advantages and the benefits it offers your teams.
LeslyIA chatbot
Benefits
Ask Lesly about an anomaly: it compares the indicators, explains the relevant parameters and suggests checks to carry out.
Your benefits
Your teams can assess the situation more quickly and prepare a targeted intervention, whilst retaining control over the decision-making process.
3D digital twin
Benefits
View the machine and its components, locate the area to be examined and compare its condition with the monitoring indicators.
Your benefits
You know where to focus your attention. Diagnostic information is shared more easily between production and maintenance.
Unified data collection from controllers
Benefits
Lesly collects data from compatible sources and links this data to machines and components in a standardised format.
Your benefits
Your mixed fleet of machinery becomes easier to monitor: you can utilise both production and machine health data together.
Deployment in just a few clicks
Benefits
The guided setup helps you discover signals, map them to components and start data collection followed by KM0 learning.
Your benefits
You can move more easily from configuration to evaluation on an initial machine, then expand the scope based on the results.
Edge Computing on LeslyBox
Benefits
Data collection and analysis take place on the shop floor. Communication with SmartFactory is organised in accordance with your OT/IT architecture.
Your benefits
You retain control over your machine data and have access to local analysis, without the need for back-and-forth cloud communication for every decision.
The KM0 approach
Benefits
Lesly learns the reference operating behaviour and then measures deviations without the need for a labelled fault dataset.
Your benefits
You can identify deviations to target checks before they impact production.
LESLY SMARTFACTORY · MACHINE HEALTH & PERFORMANCE
Anticipate deviations. Measure your progress.
Machine Health lies at the heart of Lesly: detecting deviations in your mechanical components, functional units and processes so that action can be taken before a failure occurs. The Performance module complements this intelligence by measuring production output and losses: a common basis for comparing ‘before’ and ‘after’ and then assessing the gains.
LESLY MACHINE HEALTH · MACHINE CYCLE
Anticipate deviations. Improve the reliability of your equipment and processes.
Mechanical components, functional units and industrial processes : Lesly monitors their behaviour and any deviations from their reference operating parameters. The scope is defined according to your specific requirements and the available signals, whether at the level of a component, a functional unit or a process.
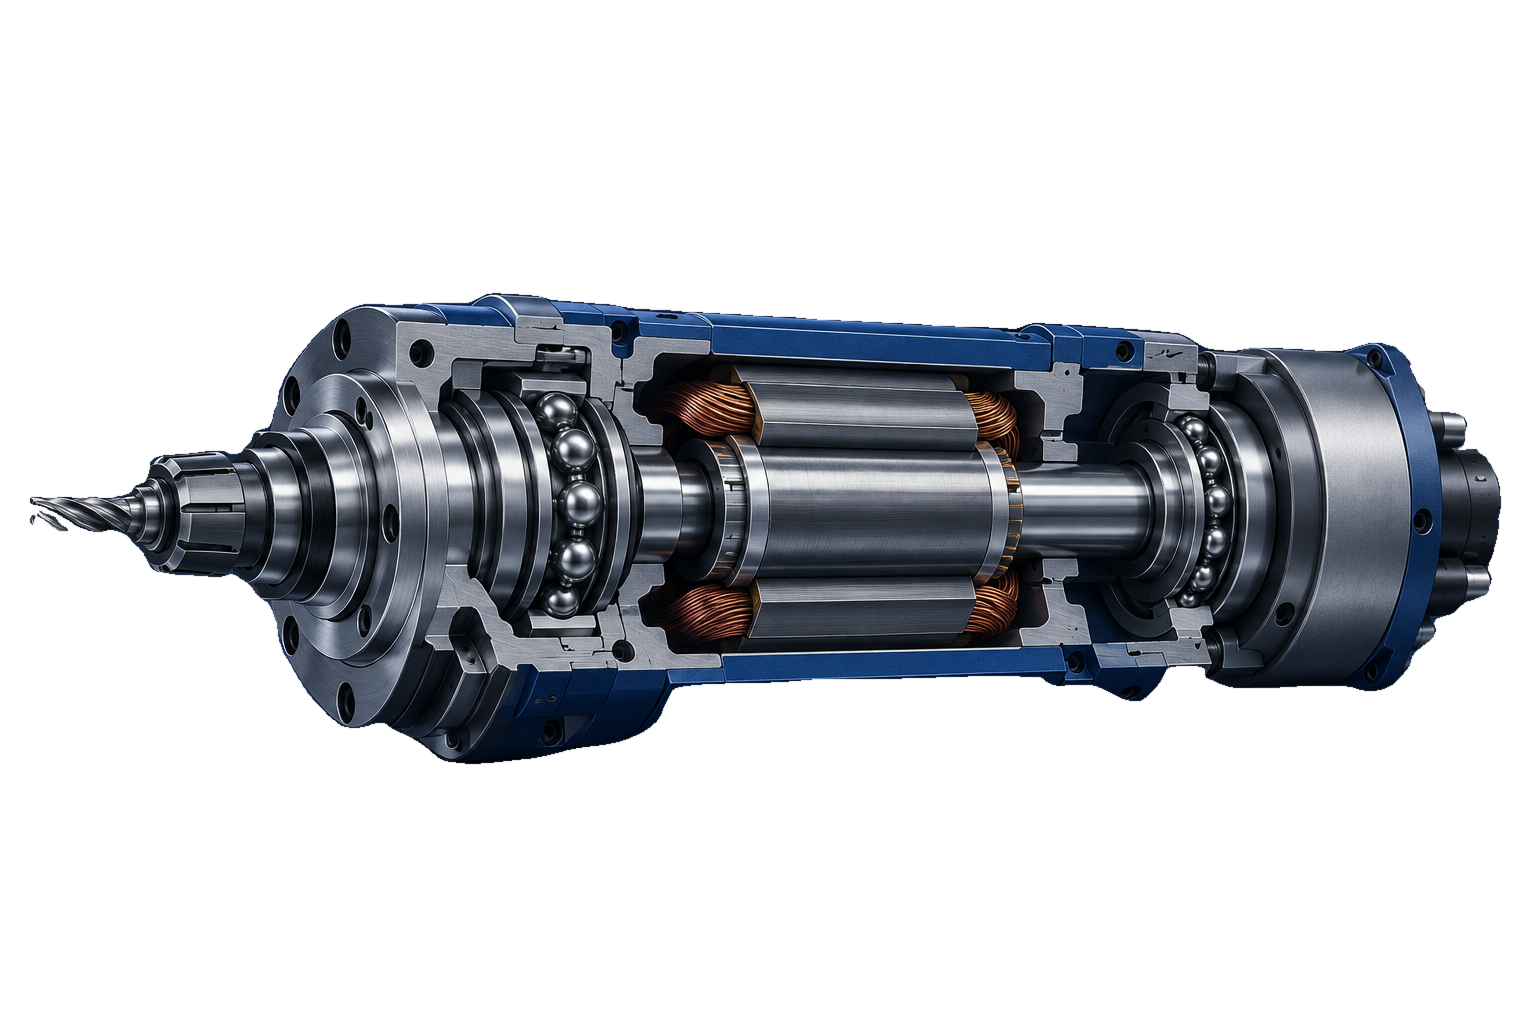
The spindle shown is an example of an application in the machine cycle : acceleration, rotation under load and deceleration. Analysing these operational signatures helps to identify signs of deterioration in the bearings, shaft and tool holder, as well as anomalies linked to wear or breakage of the cutting tool, depending on the available signals. The same monitoring principle applies to other components and assemblies within your system.
The KM0 unsupervised on-board AI learns baseline operating behaviour without a labelled fault dataset, then measures deviations. It tracks degradation, highlights influential parameters and estimates remaining useful life with a confidence level to guide predictive maintenance.
The 3D digital twin locates areas requiring inspection. The LeslyIA co-pilot explains indicators in natural language and suggests checks. Your teams assess the diagnosis, plan the intervention and use field feedback to inform future decisions.
KM0 baseline · Degradation
Monitor changes in machine condition relative to the baseline signature.
Speed · Load · Vibrations
Link deviations to cycle conditions and available signals.
Estimated remaining life · Confidence
Plan inspections based on the estimated remaining useful life (RUL) and its confidence level.
1BearingWear to monitor2TreeAbnormal vibrations3Tool holderImpact or play4ToolWear or breakage
Example: monitoring a spindle. Lesly also covers mechanical components, functional units and industrial processes. Illustrative example; no actual measurements or faults are shown.
LESLY PERFORMANCE · CYCLE PROCESS
Manage your OEE. Reduce your losses.
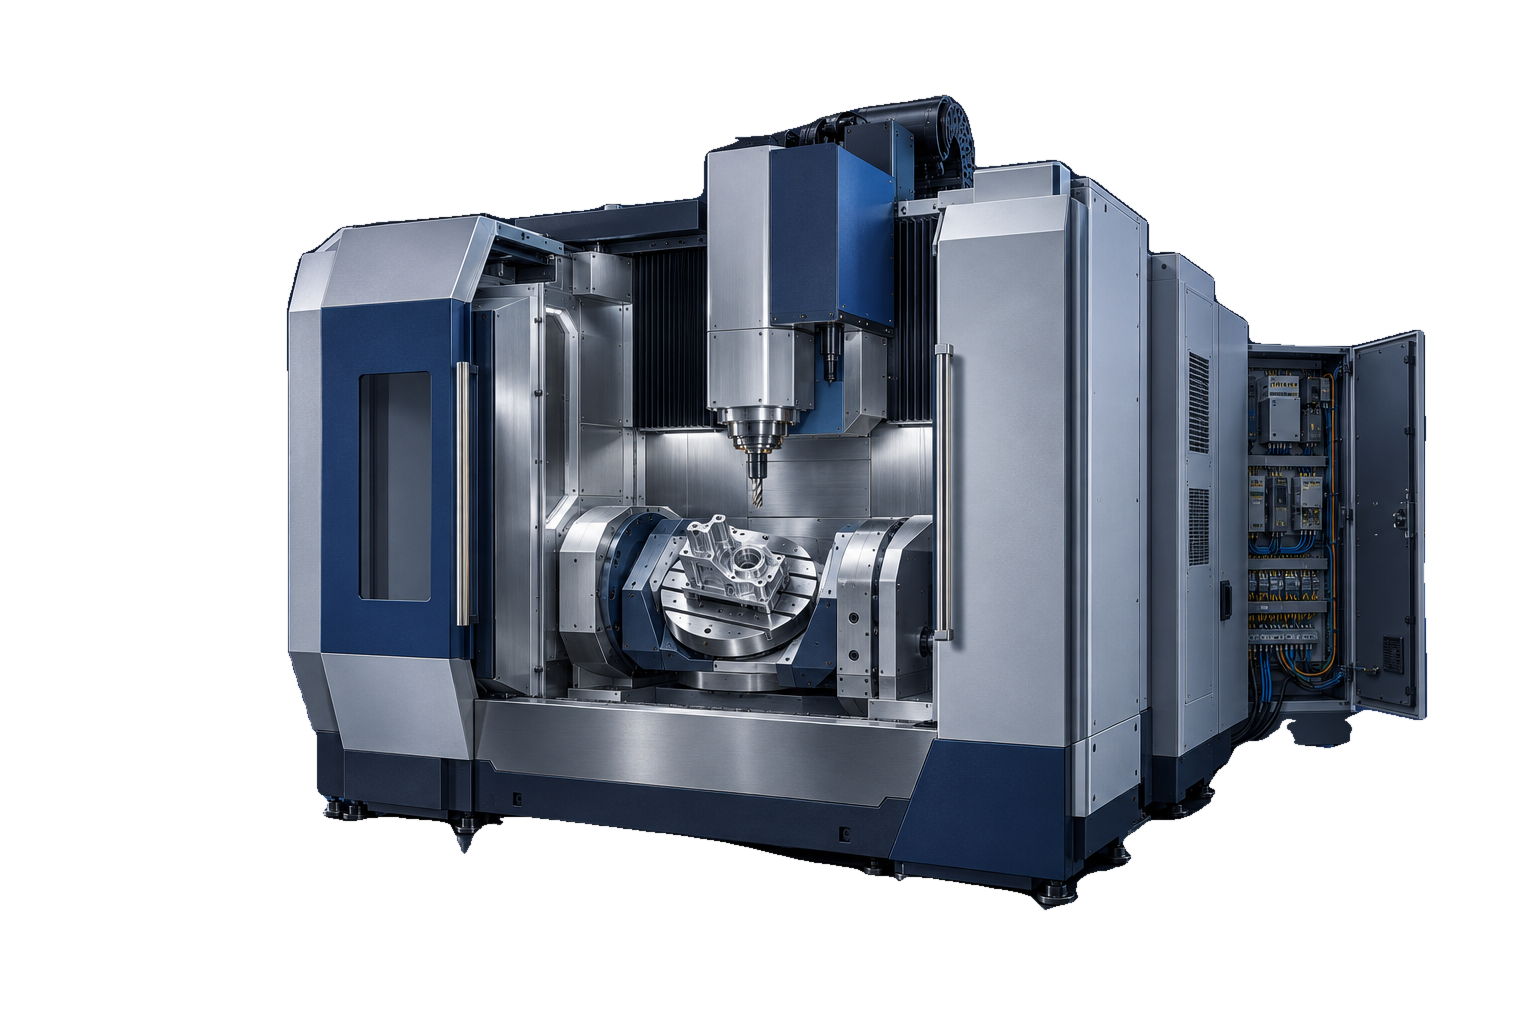
Machine tools, automated production lines and specialised machinery : Lesly monitors production using data available from your equipment. The CNC machine shown is an example; monitoring applies to your industrial cycles and processes, depending on the signals available.
Lesly automatically reconstructs the process cycle, production statuses and timelines. Productive times, waiting times, stoppages and micro-stops become measurable, without the need for operators to manually record data to reconstruct cycles. On the machining centre shown, monitoring covers loading, machining and unloading.
Follow the TRS / OEE, TRG and TEEP in real time. Identify cycles that are taking longer, variations in output rate and recurring stoppages. Compare time periods to pinpoint the causes affecting performance and measure the impact of your actions.
Quantify losses using your cost parameters. Production and maintenance teams have shared metrics to prioritise improvements, reduce downtime and make better use of workshop capacity.
TRS / OEE · TRG · TEEP
Measuring production efficiency, equipment utilisation and capacity potential.
Cycle time
Identify slowdowns and compare cycles against your production benchmark.
Status · Downtime · Cost of losses
Identify recurring downtimes, determine their causes and quantify their impact using your cost parameters.
Example: monitoring the cycle of a machining centre. Lesly also supports automated production lines and specialised machinery.
Build your digital industrial asset. KM0 data, production histories, classified faults and service reports enhance your understanding of your machines. Your investment creates value that grows as the system is used.
INDUSTRIAL CONNECTIVITY · CNC, PLC, DRIVE & IoT
Connect your workshop. Unify your machine data.
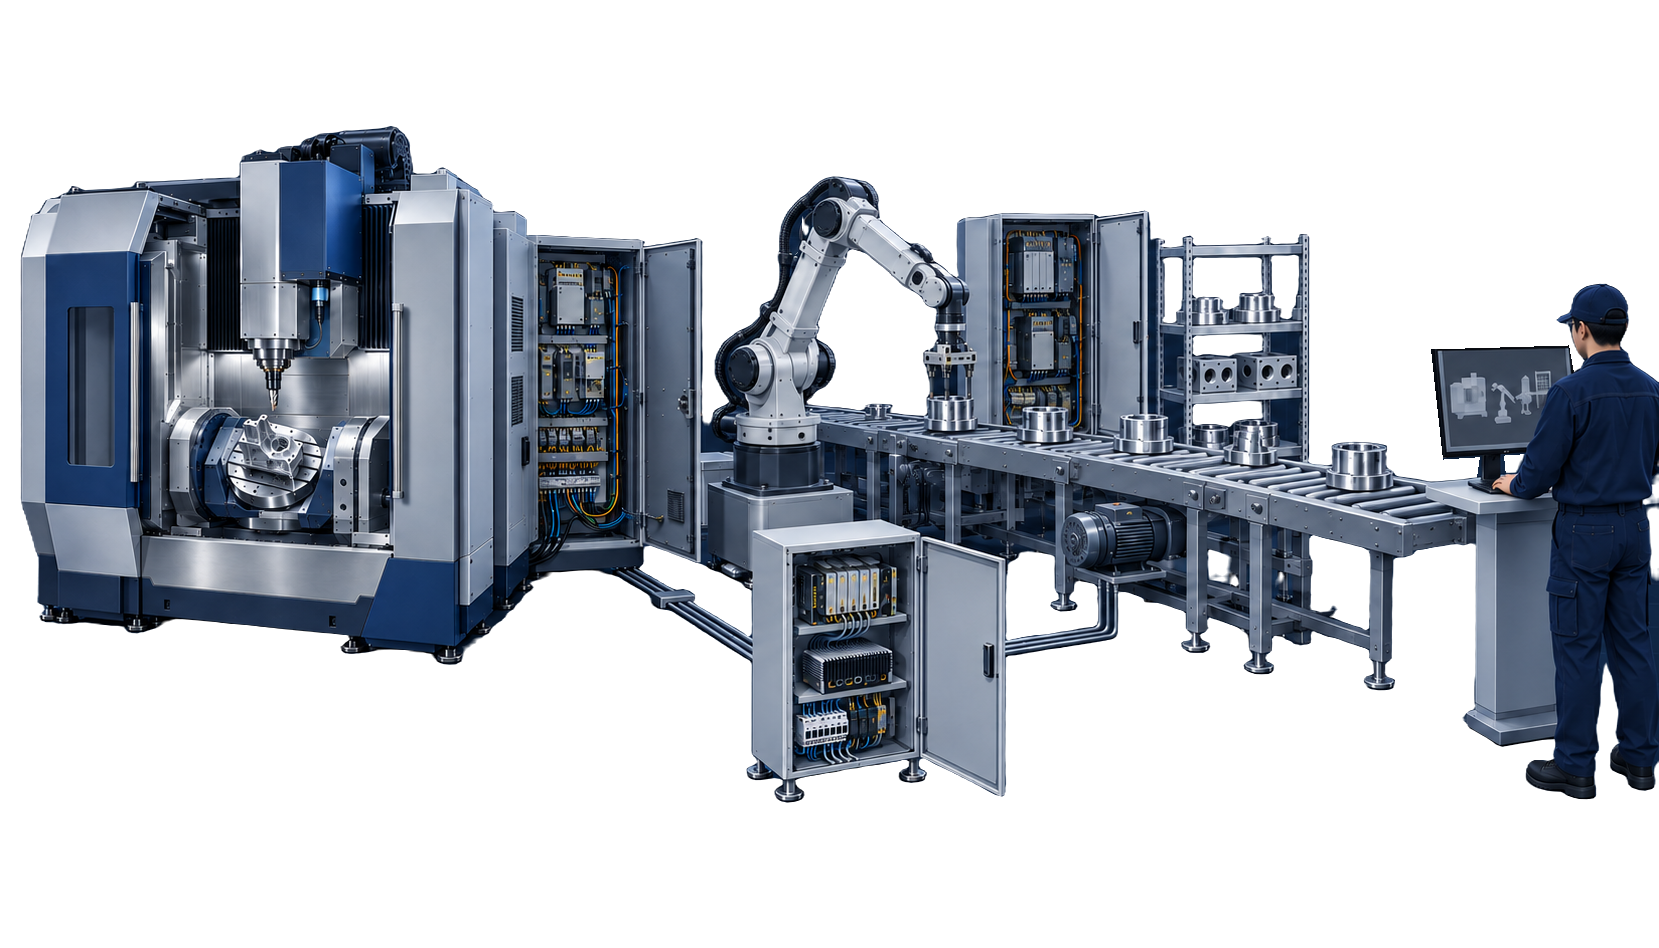
Machine tools, robots, conveyors: make the most of data from your numerical control systems, PLCs, frequency converters and IoT sensors. Lesly consolidates this data into a unified format to power machine monitoring and predictive maintenance.
ILLUSTRATIVE SCENARIO From shop floor data to management decisions.
Drag the scene to explore the workshop and the control system.
The reference points indicate the spindle, linear axis and motor monitored by Lesly.
Multi-controller connectivity.
CNC for machining, PLC for automation, DRIVE for drives and IoT for additional measurements: Lesly adapts to the data sources in your machine fleet. Data collection utilises the available interfaces, including OPC UA, FANUC FOCAS and IFM vibration sensors, depending on your equipment.
LeslyBox analyses machinery at the point of use.
Installed in the workshop, LeslyBox collects, consolidates and analyses signals locally. Each piece of data is linked to its machine and component: your production data becomes a usable basis for monitoring performance and detecting anomalies.
Monitoring to help you make decisions and take action.
With SmartFactory, the operator monitors production whilst maintenance teams prioritise checks via a shared view. Edge analysis stores machine data on-site; OT/IT data exchanges are configured according to your architecture and access rules.
Set it up in just a few clicks. Take measurements on your machines.
Connect, map, start: the guided tour simplifies commissioning. Begin with a representative machine, validate data collection and assess the benefits before rolling out Lesly across your entire machine fleet.
LeslyBox handles local analysis; SmartFactory organises your sites, machines and deployments. Our team will assist you in selecting the right signals, setting up the KM0 baseline and getting started.
Select the equipment and the pilot’s objectives: productivity, downtime or the health of a critical component. Connect the LeslyBox to compatible controllers and explore the available data.
02
Mapping components and signals.
Link the collected variables to the machines and components to be monitored. Mapping unifies your data sources to make sense of signals relating to speed, load, position or vibrations.
03
Get started with AI and production monitoring.
Start data collection: the monitoring system tracks production whilst AI learns the operating behaviour of the KM0 baseline. Validate the analyses with your teams, then use the metrics and alerts in your day-to-day operations.
04
Measure your return on investment.
Machine Health guides action; Performance measures its effects. The Performance module is essential for assessing Lesly’s ROI: it establishes a baseline and then enables a comparison of pre- and post-implementation figures using the same production indicators.
Compare similar production periods and conditions: scope, parts, working hours and workload. Measure changes in OEE, downtime, cycle times and costs, then compare the observed gains against the project cost. Distinguish the effects of actions guided by Lesly from other changes that have taken place on the shop floor.
Assess the return on investment based on three key factors:
Availability
Avoided downtime × value of one hour’s production.
Quality
Parts saved × cost of scrap or rework.
Maintenance
More targeted interventions and extended service life.
The benefits are assessed for your specific operations, without double counting. Support continues as your machinery fleet evolves.
Try Lesly for free. Your account gives you access to downloads, documentation and the machine library.
CASE STUDIES · MACHINE MONITORING IN INDUSTRY
Practical industrial applications.
Naval Group, FPT Powertrain, PCI Machining: find out how machine data analysis helps maintain precision, monitor wear and tear, and detect faults in production.
DEFENCE
AM75 · TUPC SPINDLE HEAD
Naval Group: monitoring machining accuracy.
1.21%Drift detected on TUPC_A
A submarine blade requires several months of machining. Lesly monitors deviations in the spindle head to detect any misalignment that could affect accuracy.
The challenge: to take action before drift causes damage to a high-value component.
AUTOMOTIVE
BORING · FINISHING OF INJECTORS
FPT: extending the service life of tools.
+30.4%tool life · 230 → 300 min
Lesly helps to monitor wear and tear and anticipate faults before tolerances are exceeded. Feedback from the field also reports a lack of spindle grease detected seven days before the temperature sensors triggered an alert.
The challenge: to better target replacements and minimise unplanned downtime.
MACHINING
MACHINING CENTRE · DRILLING
PCI: detecting drill breakage.
Ø 3 mmDrill breakage detected in NC data
During this drilling operation, the power monitoring system did not detect the breakage. Lesly identified it using native data from the numerical control system: torques, axis currents and position.
The challenge: to utilise the available signals without adding any sensors in this particular case.
Results reported in the Lesly use case study dated 16 June 2026. They are specific to the conditions observed and do not constitute a guarantee of similar results. Machine illustrations are based on the document provided.
LESLY DEMONSTRATION · YOUR INDUSTRIAL PROJECT
Switch to smart monitoring. Try out Lesly on your machines.
Which downtime do you want to reduce? Which component do you wish to monitor? Tell us about your equipment: we’ll help you define the scope, the appropriate modules and the success criteria for your Lesly project.